Predictive Maintenance for Industry Devices
Predictive maintenance is a subject of massive importance in industries. Failure of a machine can completely derail their entire assembly lines and lead to massive losses. An effective solution would be to predict when they might fail, and take preventive measures accordingly to prevent that, usually by performing accurately scheduled maintenance.
As my 3rd year project, me and my team developed a system that would allow us to make these predictions.
Stage 1 - Training the Model
In order to predict something, we would need historical accurate data. We found a dataset on Kaggle which would allow us to train our machine learning model on. This machine learning model will help us make these prediction.
The dataset had 5 parameters - Air Temperature, Process Temperature, Rotational Speed, Torque and Tool Wear.
Based on these, factors at a given point in time, what would be the probability of failure? If the probability is higher than let's say 70%, we will send an alert signalling that maintenance is required.
Problems in Stage 1
ML Training too difficult for a team without ML specialists
We followed a step by step, very bookish way of preprocessing the data and training the model. While the preprocessing was easy, training the models was tough.
The goal we had was to train on various kinds of ML algorithms (different kinds of classifications, regressions etc) but our team didn't have anyone with sufficient in-depth knowledge of machine learning that we could train on multiple algorithms in the provided time frame.
We had to find a solution given that the ML part was the heart of the project. Without it, it wasn't going to work. Looking for a solution, we found this python library called PyCaret.
PyCaret was an awesome ML library which automates this ML training process. It is extremely modular, so it was very easy to just put it in the google colab file after the sci-kit learn preprocessing and get our work done. It does the part of separating the test and training sets to calculate various scores all without us having to build the logic ourselves.
PyCaret also has functions for preprocessing the data, but since we had already done that with sci-kit learn, there was no real need to rewrite all that logic we built. Yes, it is true that having multiple libraries with the same end goal is bad practice, but this was just a prototype model, not for direct public deployment so it was alright.
So now that I have praised PyCaret a bit, I haven't even talked about the main killer feature - model comparison. In less than 5 lines of code, Pycaret was able to generate a table of 16 different models along with their accuracy, AUC, recall, precision, F1 score, kappa and MCC.
Gradient Boosting Classifier ended up being the best model in 5 of the 7 criteria, thus we ended up choosing it to train the model.
At the end we exported our model to a pickle (.pkl) file which we can later import in our application to make the predictions.
Lack of hardware
At the current time, we didn't have access to the Raspberry Pi Pico which we initially planned to use along with the sensors to measure the temperature, torque and rpm. We also lacked powerful systems to be able to run the ML model sufficiently fast to simulate a real time processing of the incoming data.
We resorted to using another google colab notebook for running the model. Here we generated random values within a certain range that most values in the dataset were in, and then passed them through our model. We got our predictions, and we stored all of that in a csv file.
This was our temporary 'jugad' as of the moment.
Stage 2 - Building the Backend
Well every large application needs a backend, especially if it involves data. We had to store all the incoming data in our database so that we can fetch the data in our frontend dashboard as well as analyze the state of the machines.
We decided to go with PostgreSQL as our choice of database due to mainly the amazing DX it provides. It is extremely good at handling different types of inputs and outputs, making it easy for us to pass the data in and out through csv and json files. No need to bother with generating, mapping and fetching the data from a Result Set, which is common in MySQL with JDBC.
For our backend we decided to go with Node + Express. Mainly because I had experience working in it. Express made setting up a backend server very easy. The postgres driver in Node was also really good and simple to setup.
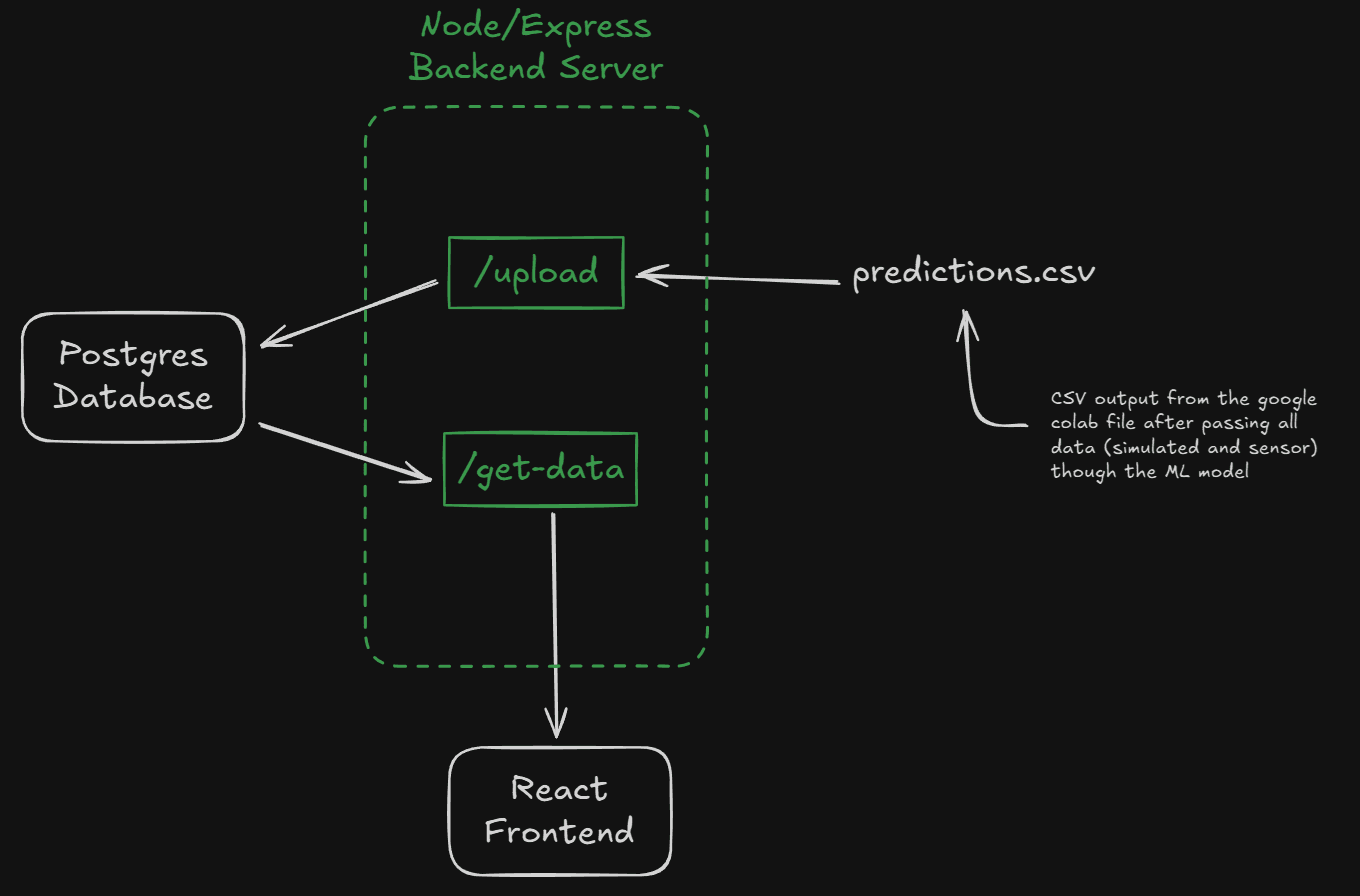
We had two APIs - inserting data and fetching data.
For fetching data, it was simple since postgres can send the output in JSON format. For inserting the data, we took the csv file generated from the google colab and uploaded it to the backend server which added the entries to our database.
Problems in Stage 2
Duplicate entires in CSV
So remember where I mentioned generating a CSV file with random values? Well everytime we ran that we ended up appending new data to the already existing CSV file. So when we passed this through our backend, it ended up creating duplicate entries in our database (with an autogenerated primary key obviously).
To handle this issue we had to alter our database with a time stamp attribute which would also be part of the CSV file now. Then I wrote a function to compare every timestamp in the csv with the database, and skipped over any duplicated.
Not the most ideal solution, since we would add each entry line by line right away after getting the prediction, but there is the issue of the asynchronous nature of databases. It is simpler and more read/write efficient to make those entries in bulk. And ideally we also create a new CSV file every time we run the simulations - or when we add the sensors, in every batch of time.
PostgreSQL issues in Windows
For some reason we weren't able to figure out, connecting our postgres database to our backend just didn't work on Windows.
At the end, I ended up installing WSL (Windows Subsystem for Linux), setting up our postgres database there and the connection worked flawlessly. Linux is as usual a fantastic environment for any type of development, given that majority of the servers in the world run on it.
WSL also ended up being a phenomenal shell, which I now almost always use instead of the default powershell on windows.
Stage 3 - The Dashboard
It is possible to analyze data and get warnings without a user interface as long as our backend server is running, but having a dashboard that can show the live statistics is always a benefit.
We used React with Typescript to build our website, which includes this dashboard. The dashboard calls the backend to get the data from the database. We displayed the table of the data, as well as used chartJS library to plot it, thus allowing us to see the pattern in the increase/decrease in failure probablity of the machine.
This was a simplistic UI, so didn't face much of any major problems worth mentioning other than the debugging minor issues.
Stage 4 - The Internet of Things
This is the part of the project on which we procrastinated on the most. Our team had people familiar with ML even though non of us were experts, but handling hardware was completely new for everyone.
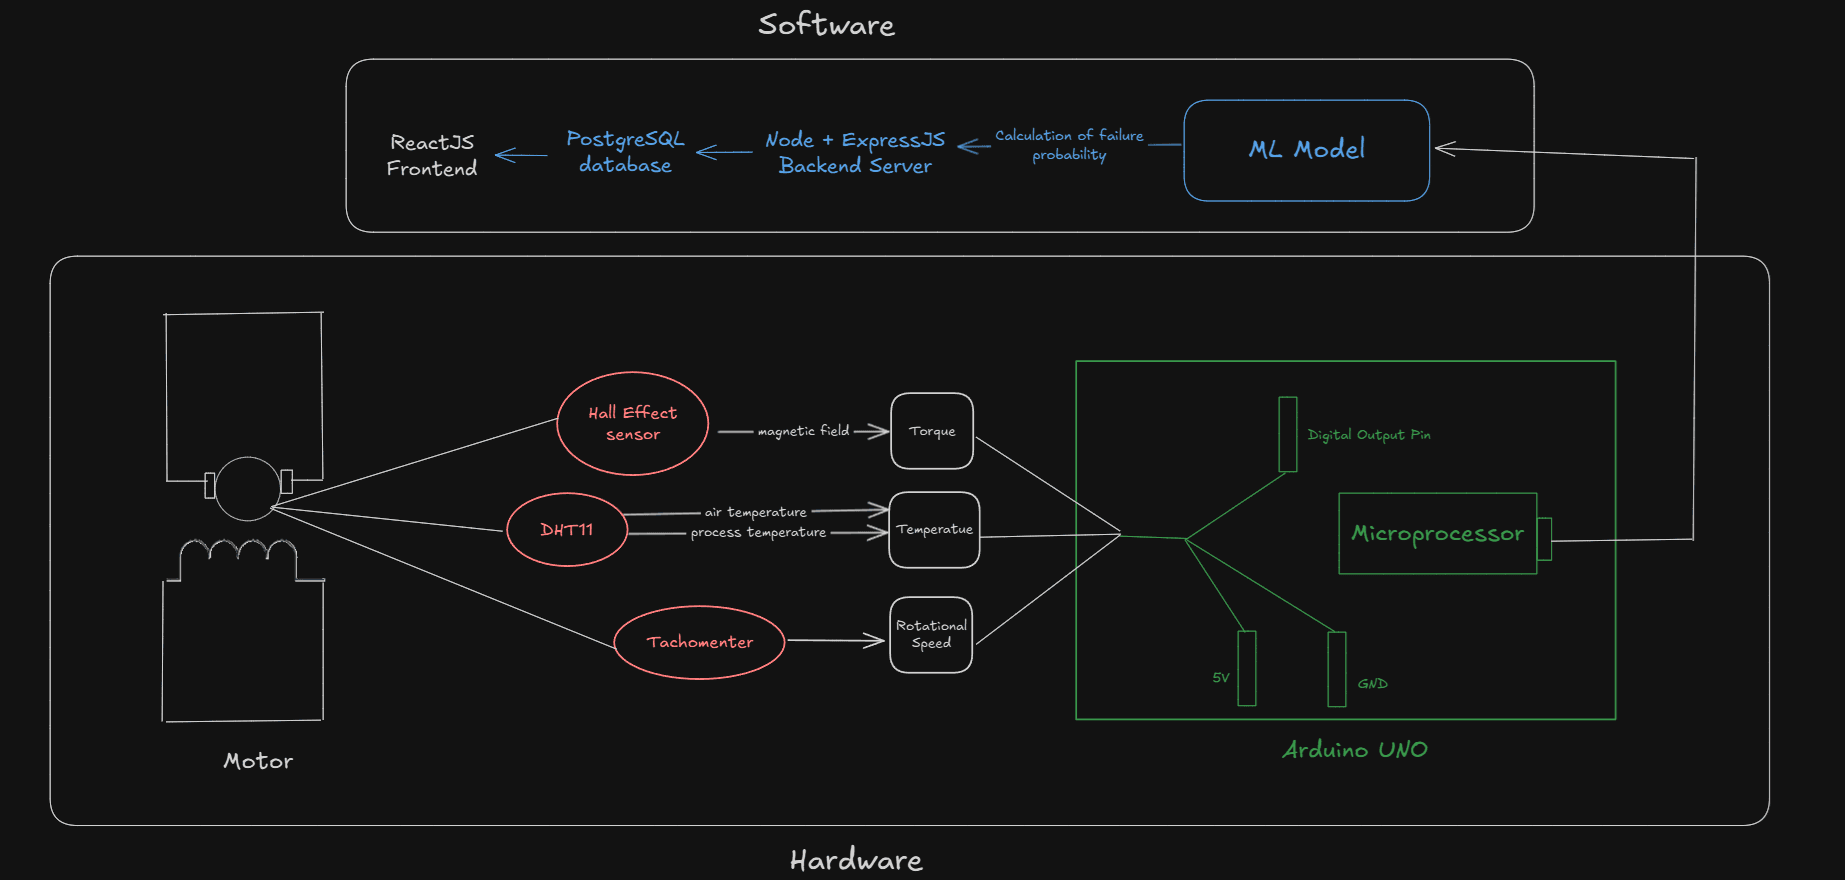
We got access to the labs at our college, and we had to use an Arduino UNO instead of our initially planned Raspberry Pi Pico. We only got two DHT sensors which measure temperature and humidity. So we decided to only measure the process and air temperatures and let the other data points be simulated.
Problems in Stage 4
Unable to stream data to the ML model
So when we got our sensors working on the Arduino and wrote the code to get the data, we were only able to see the data being streamed in the Arduino IDE. And with our current setup, we had to pass that data in a code block in google colab. This was a major challenge.
After lots of searching, I found this tool called CoolTerm which allowed us to stream that data into a text file. Since CSV files are at their core text files, by formatting the output a bit we were able to get the temperature readings out from the sensors and store them.
Then uploading this CSV file to google colab and modifying the code to read the temperature readings, we were able to get that part of our workflow working. We got the predictions, and we were able to send the predictions to the backend to add to the database.
Stage 5 - Migration to Cloud (In Progress)
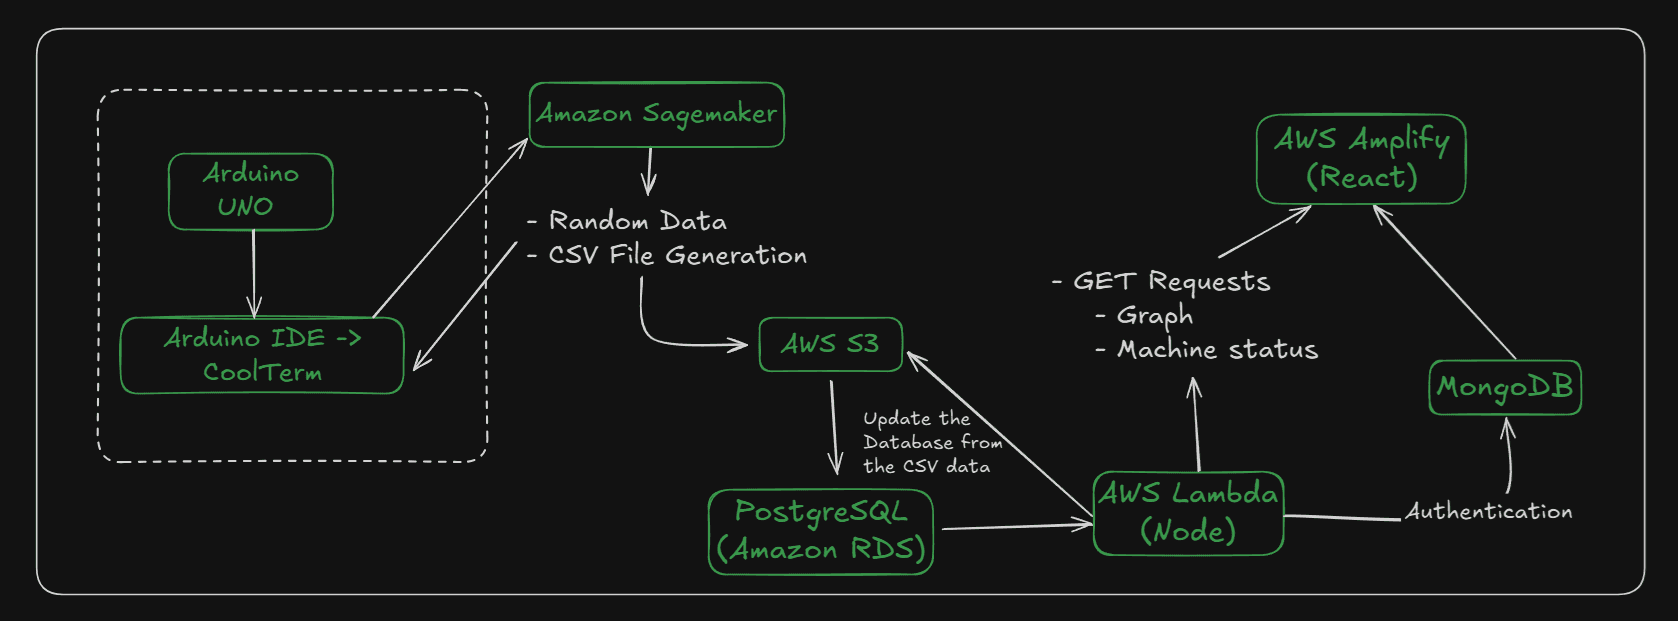
We were able to make a good working demo of our project to predict the failure rate of industry devices and machines. We didn't have enough time left to deploy all these to the cloud (specifically AWS) and make it working there. We had a plan but due to time constraints, we weren't able to do it.
The main plan for this is as follows -
- Deploy the frontend on AWS Amplify
- Upload the backend to AWS Lambda
- Migrate the database to Amazon Aurora/RDS (depending on the more cost-efficient one)
- Refactor the google colab file which passes the data thorugh the ML model to get the predictions and run it on Amazon Sagemaker
- Add a Cloudwatch alert to detect new uploads of the sensor data
- Connect all the parts together and automate to make it all work with minimal manual efforts
In conclusion, our project successfully delivered a functional, end-to-end proof-of-concept for a predictive maintenance system. By integrating a machine learning model trained using PyCaret, a Node.js backend with a PostgreSQL database, a React-based monitoring dashboard, and an Arduino-powered IoT component for data acquisition, we created a comprehensive solution. Despite facing challenges such as limited ML expertise, hardware constraints, and integration issues, we employed resourceful solutions at every stage. The result is a working demo that can ingest sensor data, predict machine failure probabilities, and visualize the results, laying a solid foundation for the planned future deployment on a scalable AWS cloud architecture.
Credits to my teammates - Vaibhav Kumar Kandhway, Shivam Goel, Yuvraj Singh, Yuvraj Trivedi, Amruth Alur, Nirmit Bansal and Palash Chaturvedi.